Wilmar been building its accumulation base since 2012.
It has been pushing higher since last July / Auguest, as it had applied to list its China business, Yihai Kerry Arawana Holdings (YKA) on the Shenzhen Stock Exchange.
"Wilmar's YKA may reach $19.7b valuation in IPO: analyst"
Wilmar counts China, where it has more than 300 plants and a wide marketing and distribution network, as a major market.
It broke doen from its important mid-line during Feb 2020 amd then plunged rapidly further down, breaking through pitchfork channel bottom to test oversold level 1 in March 2020.
STI these 2 days have been indecisive. Watch bulls or the bears to win the tug of war.
Note the day high level of Tuesday and then the day low level of Wednesday, then see where the price go to breakout either this level, this will be the direction.
https://t.me/NewsUpdateLearning
Find my timely updates @ WhalePool Traders Digest, the channel for SG US Market news updates learning leisure entertainment lifestyle relationships building
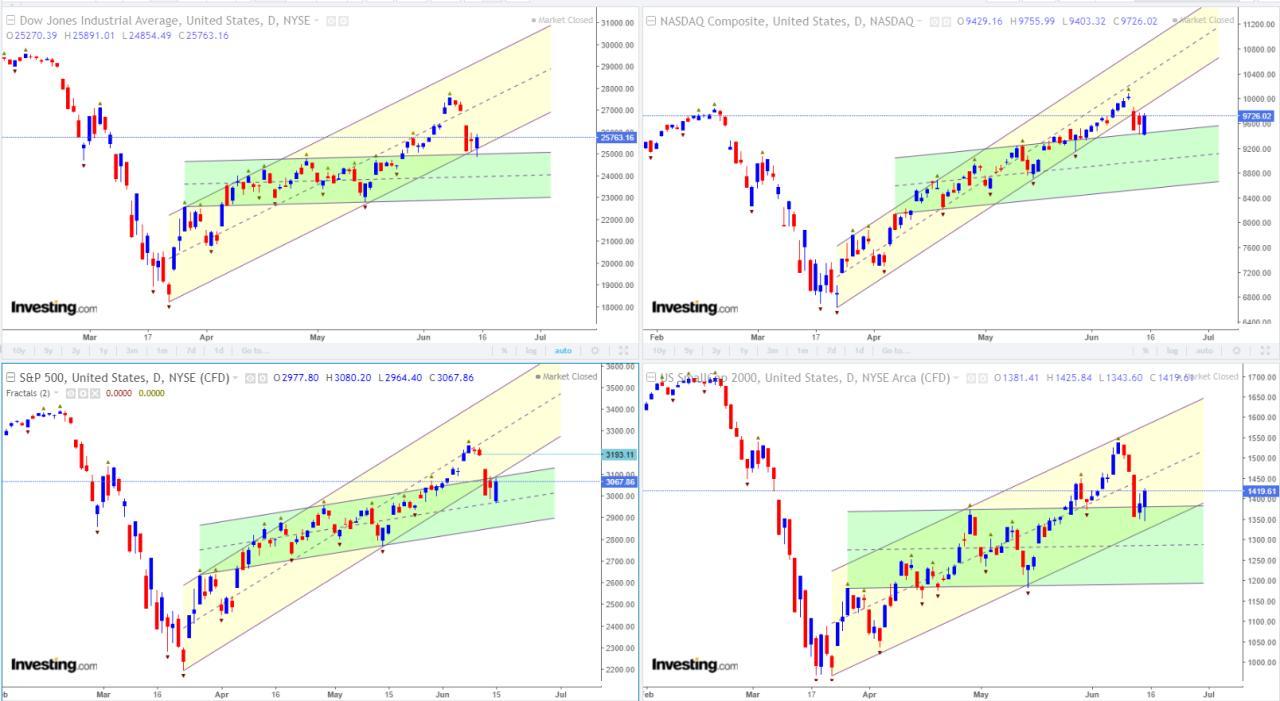
DJIA down 6.9% (-1861.81 points) @ 25128.18 as it closed on its parallel channel bottom with much higher volume by gap down significantly below its 200ma and then moved lower passed its 20ma.
STI has been resisted from entering by its 2018 May bear channel bottom (pink line) since breaking it in March. The pink line resistance and the tight ranging STI. Is STI is prime for a breakout soon?
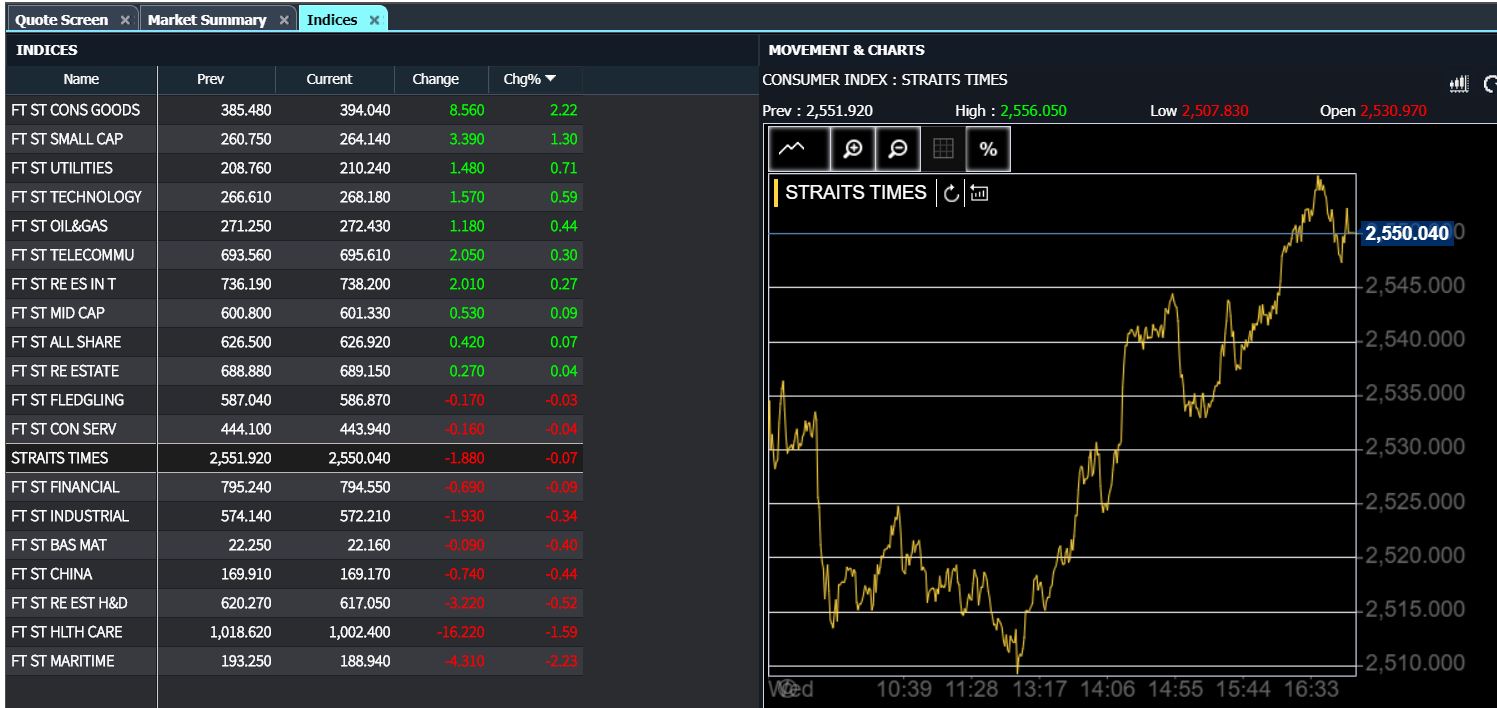
STI turned green for a brief moment before closing at 2,550.04, lossing just 1.88 points (0.07%).
STI gap down 21 points at open. Slide to day low (2,507.83 points) before surging to 2,556.05 (+3.1).
I had set the support at 2511 in yesterday report that "When bearish mometum follows through, STI would test its 10-day low at 2511". The coming sessions to watch if STI can go sideway instead after closing outside of its up parallel channel yesterday.
2,550.040 -1.88 (-0.07%)
STI opens lower and closes still down 1.88 points
22 Apr 2020 17:54
By Marissa Lee
The Straits Times Index (STI) opened lower on Wednesday after Singapore further extended the partial lockdown period by four weeks, but clawed back gains over the day to close just 1.88 points lower or 0.07 per cent at 2,550.04.
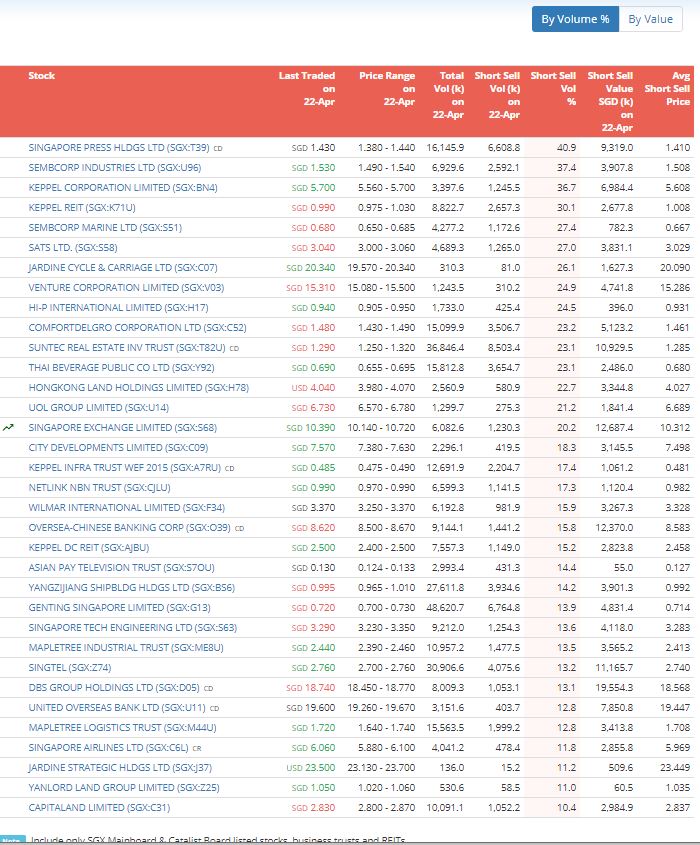
About 2.34 billion securities worth S$1.53 billion were traded. Gainers outnumbered losers 235 to 183.
CGS-CIMB has a year-end price target of 2,050 for the STI. CGS-CIMB analyst Lim Siew Khee wrote in a note: "As companies start to update on quarterly progress and give their outlook this week, we believe reality could sink in as a great deal of uncertainty remains in areas such as banks, small caps and cyclicals.
"We also see profit taking opportunities in names that could be challenged in a recessionary environment, including gaming, travel-related stocks and developers. We expect market earnings per share to decline 17.5 per cent in 2020 and rise 9 per cent in 2021, and see more downside to our 2021 forecasts as the second-order effects of a recession kick in."
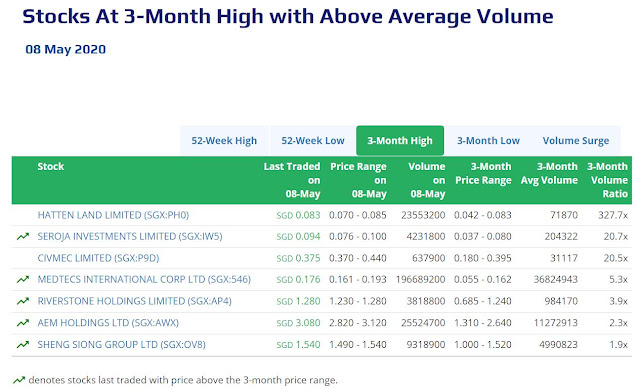
Medtecs International was the most actively-traded counter, jumping 31.31 per cent or 0.031 to S$0.13 on volume of 184.3 million.
Singapore Exchange (SGX) was the top gainer, rising 3.28 per cent or S$0.33 to S$10.39 on expectations of strong growth when it reports its third-quarter results before market open on Friday (April 24).
Hotel Royal was the top loser, falling 10 per cent or S$0.30 to S$2.70 on 100 units traded.
Regional markets also lacked direction. The Hang Seng rose 0.42 per cent, the KLSE rose 0.01 per cent, the Nikkei was down 0.74 per cent and the Shanghai Composite rose 0.60 per cent.
Stocks - Wall Street Falls, Pressured by Oil Gloom
DJIA lost by 2.67% (631.56 points) to close at 23018.89. It gap down from its broken rising wedge pattern to and then closer lower than its parallel channel mid-line.
SP500 dropped 3.07% (86.60 points) to close at 2736.57. It has closed lower than its rising wedge bottom and its parallel channel mid-line.
VIX shot up 47.77 but only par gains to close at 45.41 points (gaining 1.58 points, 3.6%). VIX looks like ranging .
Nasdaq lost 3.48% (297.50 points) to close at 8263.23. It has closed below its parallel channel mid-line but a above its 50% Fibonacci retracement level.
Russell 2000 slide 2.33% (28.253) to close at 1185.094. It has the least loss compared t the other 3
Stocks - Wall Street Falls, Pressured by Oil Gloom By Geoffrey Smith Investing.com -- U.S. stock markets remained sharply lower for a second-straight day on Tuesday as a string of corporate warnings about the impact of the Covid-19 pandemic reinforced a painful hangover from Monday's volatility in oil markets. By 11:25 AM ET (1525 GMT), the Dow Jones Industrial Average was down 610 points, or 2.8%. The S&P 500 was down 3.1% and the Nasdaq Composite was down 3.8%, the latter in part due to weak data on exports of South Korean semiconductors. All three indices had fallen heavily at the start of the week as crude oil prices had turned negative due to crushing oversupply in the spot market. The psychological shock of seeing oil, the world's most important commodity for the last 100 years, trade below zero for the first time on Monday has been profound. Of the majors, only Exxon Mobil (NYSE:XOM) outperformed the broader market, remaining basically flat. while Chevron (NYSE:CVX) stock was down 1.7%, and ConocoPhillips (NYSE:COP) was down 2.75%. Smaller upstream companies were outperforming slightly after heavy falls in the previous session. Analysts at Goldman Sachs (NYSE:GS) argued in a note to clients on Tuesday that while the coordinated cut by OPEC and its allies had been "too little, too late" to save prices in the current quarter, but created the basis for a solid rebound in the second half. President Donald Trump, meanwhile, raised expectations of a possible bailout for the sector on Tuesday, tweeting that: "We will never let the great U.S. Oil & Gas Industry down. I have instructed the Secretary of Energy and Secretary of the Treasury to formulate a plan which will make funds available so that these very important companies and jobs will be secured long into the future!" Congressional Democrats had previously blocked the appropriation of some $3 billion for purchases to fill the Strategic Petroleum Reserve, and do not appear to have changed their position since. Trump mentioned on Monday that an import ban on Saudi oil could be considered. Away from the oil patch, a number of heavyweight stocks underperformed after the Covid-19 pandemic hit their reports for the first three months of this year; Coca-Cola (NYSE:KO) warned that the closure of social venues would hit it particularly badly in the current quarter, while IBM (NYSE:IBM) stock fell 5.9% after it warned of a sharp drop in business investment after the bell on Monday. Big Blue returned to its trend of falling revenue as clients deferred major upgrades to their IT. German rival SAP's ADRs (NYSE:SAP) fell 5.8% after the departure of co-CEO Jennifer Morgan less than six months after she was promoted to the job. Lululemon Athletica (NASDAQ:LULU) stock had a different sort of Covid-19 problem after a rogue art director promoted a T-shirt with the motif "bat fried rice", triggering outrage in China, where it was perceived as a reference to the livestock market in Wuhan where the virus is believed to have jumped species. Lululemon stock was down 4.1%. By contrast, the day's biggest gainer was Beyond Meat (NASDAQ:BYND) stock, which rose more than 5% after announcing a distribution deal with Starbucks (NASDAQ:SBUX) in China. Demand for plant-based alternatives to meat is seen by both companies as being structurally supported by the negative publicity around China's policing of its food chain. https://www.investing.com/news/stock-market-news/wall-street-opens-lower-as-earnings-add-to-oil-gloom-dow-down-500-2146357
Fear and Greed Index
On this page, you will find our latest updates on the CNN Fear and Greed Index.
The CNN Fear and Greed Index in its purest form answers the question, “What is the predominant emotion of the stock market right now?”
It’s a sentiment indicator that tells if equities are undervalued or overvalued. The logic behind it is that too much greed can push stock prices beyond their fair price, while too much fear can cause stocks to slip well below their intrinsic price, as traders don’t act rationally in the short-term.
The Fear and Greed index uses seven indicators to conclude the extent of the market’s fear and greed and measures the market’s sentiment based on these two emotions on a daily, weekly, monthly, and annual basis. The following metrics compose the index and aim to provide a holistic view of the market’s emotions:
Put and Call Options: How much have put options lagged behind call options? Market Momentum: Where is the S&P 500 relative to its 125-day average? Stock Price Strength: It counts the number of stocks that have touched 52-week highs vs. 52-week lows on the New York Stock Exchange (NYSE). Stock Price Breadth: The McClellan Volume Summation Index compares the volumes on rising stocks versus declining ones. Safe Haven Demand: How well are stocks performing compared to safe-haven assets like US Treasury bonds? Market Volatility: It uses the Chicago Board Options Exchange Volatility Index (VIX) relative to its 50-moving average. Junk Bond Demand: What is the spread between junk bonds and safer, investment-grade corporate bonds?
How to use the Fear and Greed Index?
The seven metrics are individually-measured on a scale of 0-100 with lower numbers indicating fear while higher figures pointing to greed. They are then weighted equally to calculate the Fear and Greed Index.
The index is a great tool to help investors and traders get an idea of when it is time to enter the markets. When the Fear and Greed index is trading near its recent extreme lows it hints that a significant bottom in the market is pending. The index should be interpreted with the help of technical analysis to improve entry signals. It is also possible to use the index to figure out when the market is overbought, but at least historically, the indicator is less useful to predict significant highs.
DISCLAIMER:
Hello,
All information updates, tables and charts are for informational purposes only; they are not intended for trading purposes or advice.
We do not and cannot guarantee the accuracy of the information.
Please consult your broker or financial representative to verify pricing before executing any trade.
We are not liable for any actions taken in reliance on information contained herein.
STI dropped 1.77% (45.93 points) to close at 2551.92.
On the day chart, STI has retreated back to the small consolidation top it burst out from 6 sessions ago after closing outisde of its rising wedge yesterday. When bearish mometum follows through, STI would test its 10-day low at 2511.
2,551.920 -45.93 (-1.77%)
STI down 1.77% on Tuesday as S'pore extends partial lockdown by 4 weeks
21 Apr 2020 17:36
By Marissa Lee
THE Straits Times Index (STI) closed down 45.93 points or 1.77 per cent at 2,551.92 on Tuesday, as punters braced for bad news on the back of the 4pm announcement by Prime Minister Lee Hsien Loong that he would address the nation at 5pm.
When he did, he announced a four-week extension of the "circuit breaker" partial lockdown measures to June 1.
About 1.63 billion securities worth S$1.47 billion changed hands on Tuesday. Losers outnumbered gainers 341 to 111.
The most active counter was Biolidics, which recently got permission to market and sell its Covid-19 rapid-test kits in the US. It jumped 40.79 per cent or 15.5 cents to S$0.535.
Sevak was the top gainer, rising 11.33 per cent or S$0.17 to S$1.67. Jardine Matheson was the top loser for the second day running, falling 2.10 per cent or US$1.08 to US$50.40.
The market was especially bearish after May futures contracts for the US crude oil grade West Texas Intermediate (WTI) turned negative for first time, as the Saudis mounted a squeeze on US shale oil producers.
This is the first time that WTI has traded at less than half the price of Brent, but Bank of Singapore currency strategist Sim Moh Siong noted: ?The WTI oil market is a reflection of the supply glut in Cushing, not a reflection of the international oil market, which more closely follows Brent crude. Additionally, unlike Brent, the WTI contract is settled through physical oil delivery. We continue to project Brent crude price to rebound to US$45 per barrel in a year?s time.?
The market is also weighing the fallout from the oil rout, not just of oil and gas players, but their counterparties, whose collateral may be worth a lot less than before.
In a report last Friday, UOB Kay Hian analyst Jonathan Koh estimated that DBS Group has a S$400 million exposure to Singapore's insolvent oil trader Hin Leong: "Management disclosed that DBS? exposure to offshore-support vessels is currently at S$3 billion, which is half the S$6 billion at end-2016."
He said he expects DBS's net profit to fall by 25 per cent in the first quarter from the year-ago quarter when it reports on April 30.
He is also expecting DBS to trim dividends by 9.1 per cent to 30 Singapore cents per quarter, supported by reactivating its scrip dividend scheme, he wrote: "We expect a surge in credit costs to 60 basis points (2019: 18 basis points), driven by higher general provisions... caused by a deterioration in macroeconomic variables, and more loans downgraded from stage 1 to stage 2, which requires more provisions based on lifetime expected credit loss... We have assumed new non-performing loans of S$971 million during the quarter (Q419: S$575 million)."
Regional markets were awash with red. The Hang Seng and KLSE were both down 2.22 per cent.