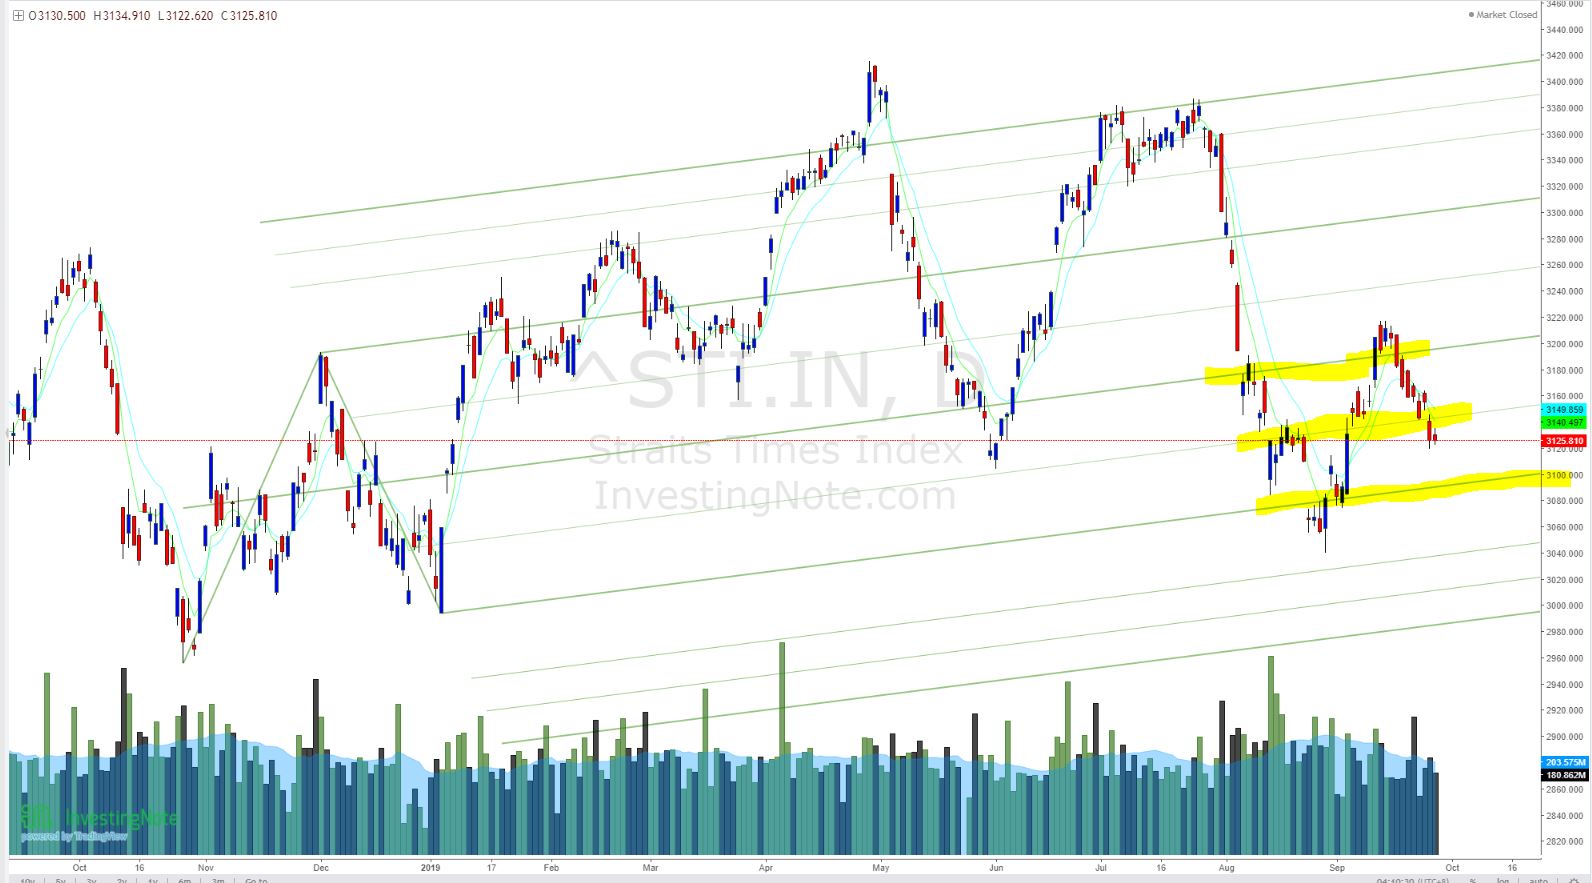
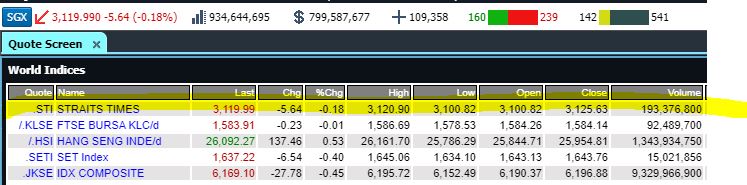
Looks like short-covering took place to fill the gap, parring losses to close at 3119.99.
Bulls and bears still fighting as neither has been able to force STI to close above the Doji or below it.


Source and recommended reads :
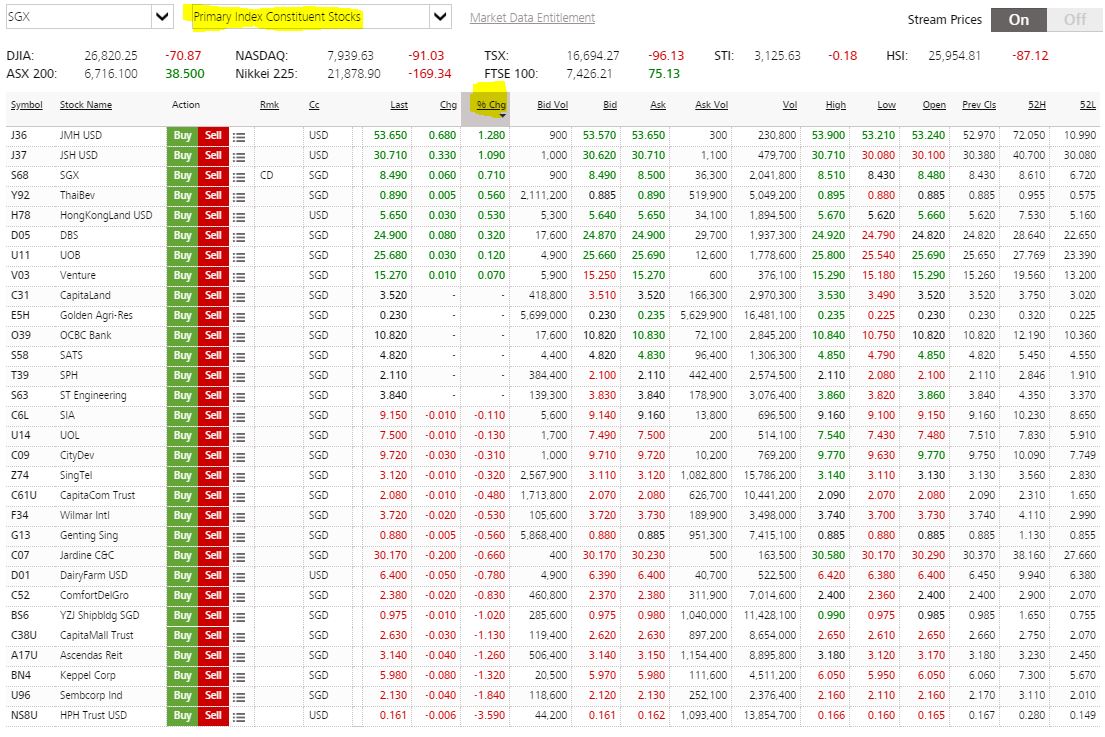
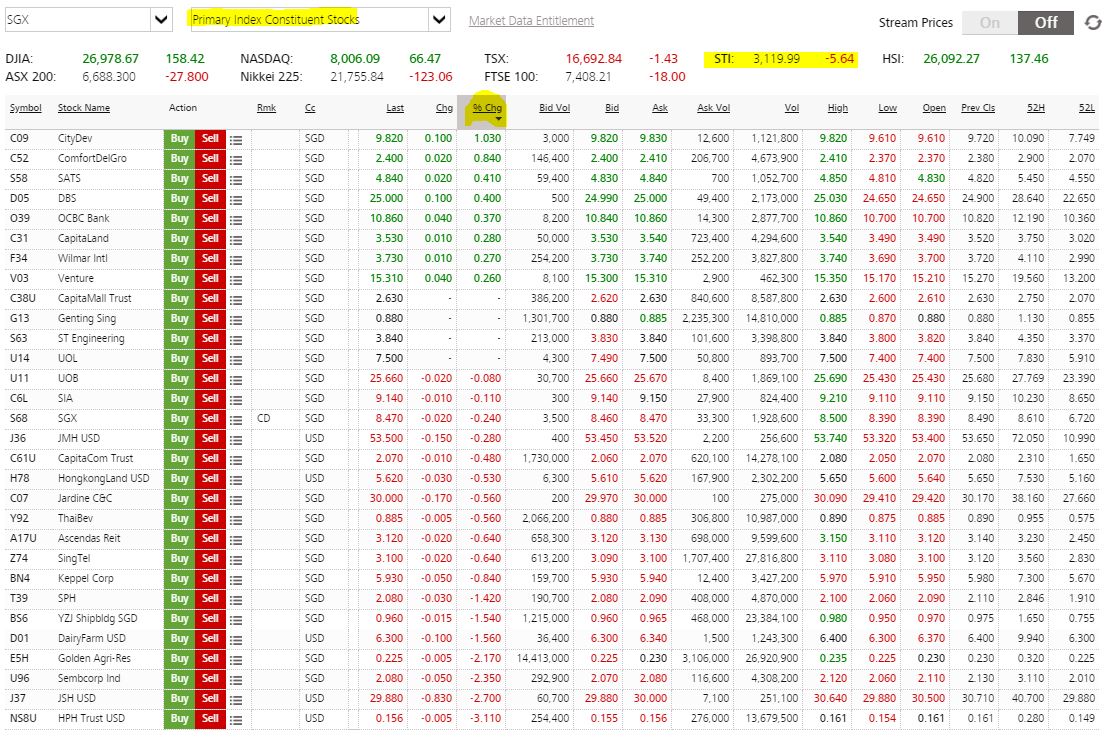
https://sginvestors.io/market/sgx-share-price-performance/straits-times-index-constituents
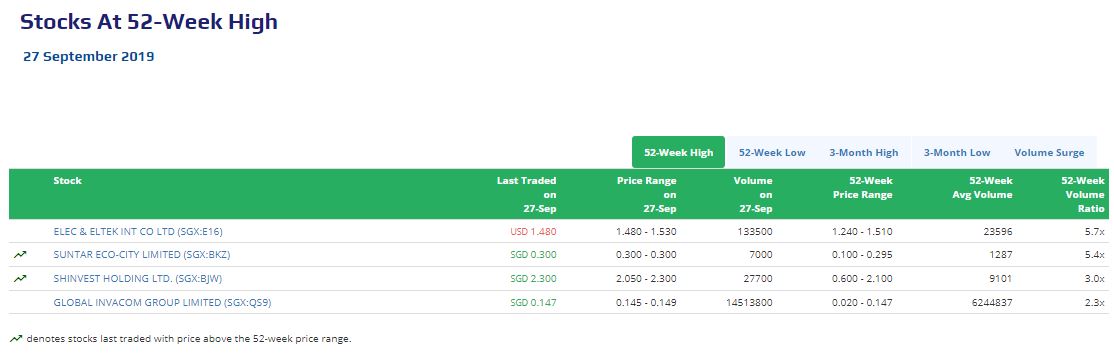
https://sginvestors.io/market/sgx-breakout-price-3-month-high-volume-above-average
https://sginvestors.io/market/sgx-breakout-price-3-month-high-volume-above-average
https://sginvestors.io/market/sgx-breakout-price-3-month-low-volume-above-average
https://sginvestors.io/market/sgx-top-volume
https://sginvestors.io/market/sgx-top-volume
https://www.investingnote.com/stocks?sort_sequence=top_active&country=sg#
Singapore business
news
https://www.businesstimes.com.sg/stocks
https://www.straitstimes.com/business/companies-markets
https://www.theedgesingapore.com/
US Indices &
stocks performance
https://www.investing.com/indices/
https://money.cnn.com/data/fear-and-greed/
DISCLAIMER:
Hey,
All information updates, tables and charts are for informational
purposes only; they are not intended for trading purposes or advice.
We do not and cannot guarantee the accuracy of the information.
Please consult your broker or financial representative to verify pricing
before executing any trade.
We are not liable for any actions taken in reliance on information
contained herein.
With best regards,
Martin Seah